Financial Highlight
Please slide it sideways to see it.
You can see the following information in the graph.
|
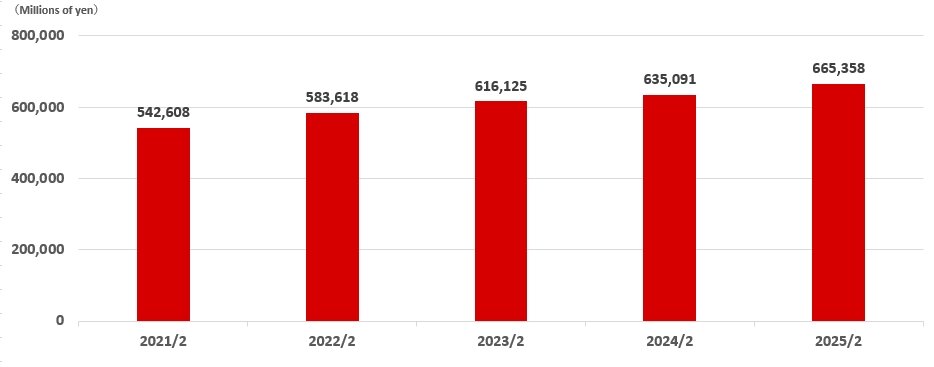
Net sales
/
|
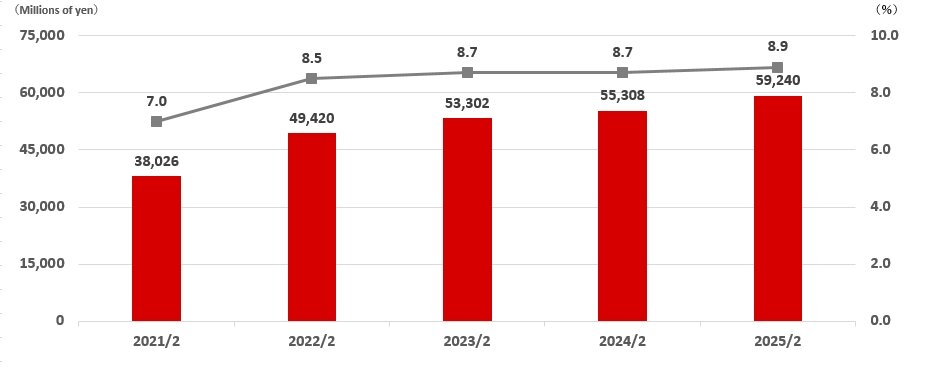
Operating income / Operating income margin |
|
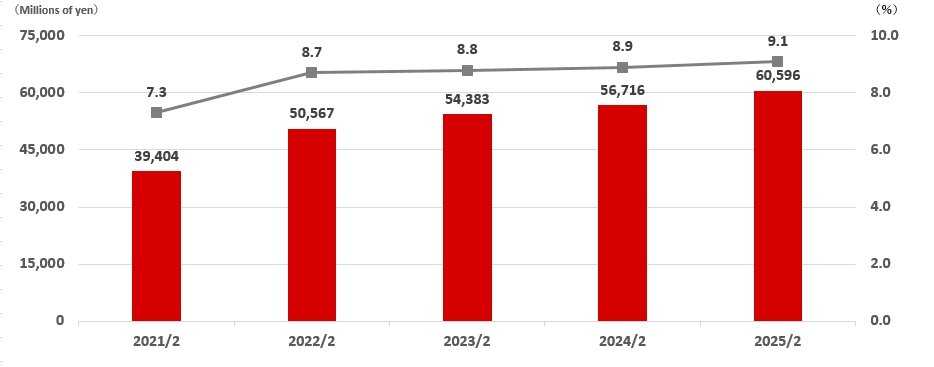
Ordinary income / Sales ordinary rate of return
/
|
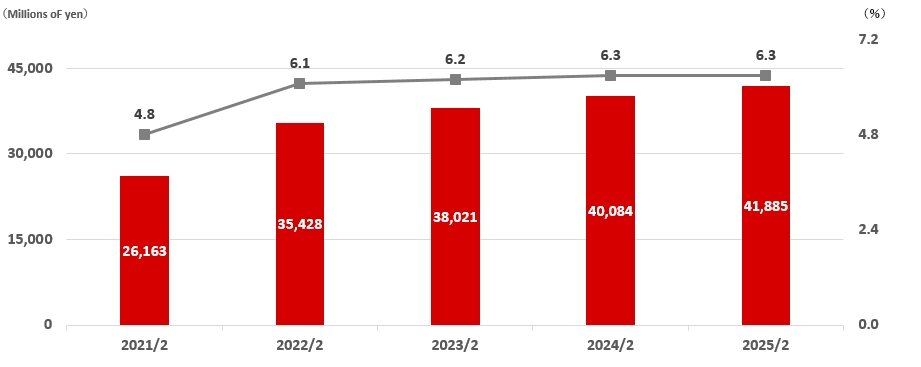
Net income / Net income margin |
|
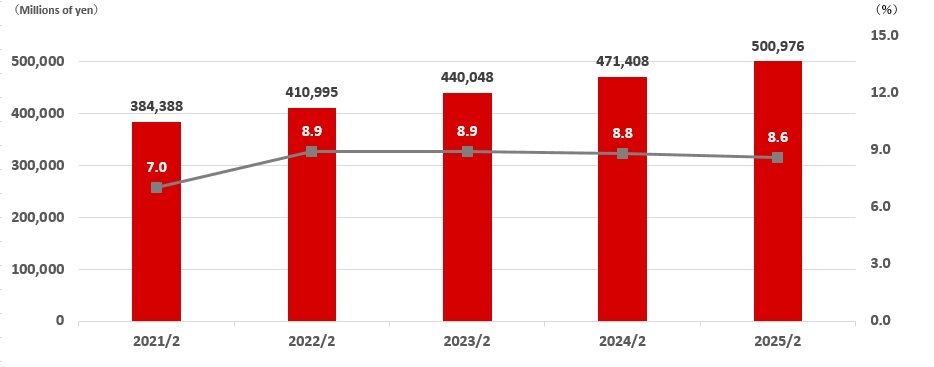
Net assets (equity capital) / ROE
/
|
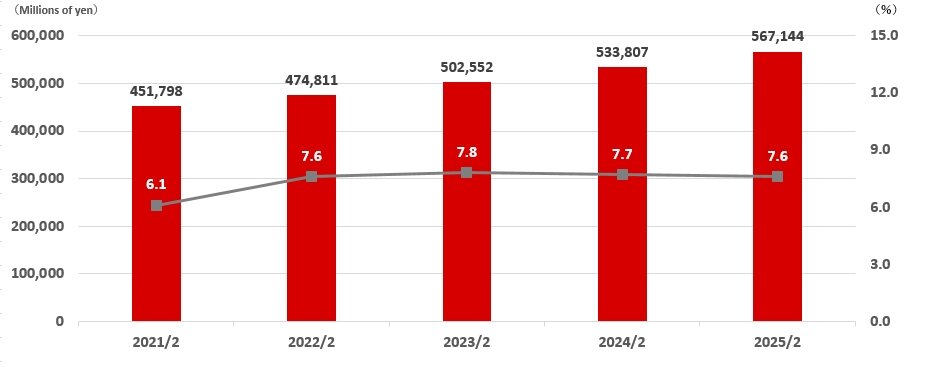
Total assets / ROA |
|
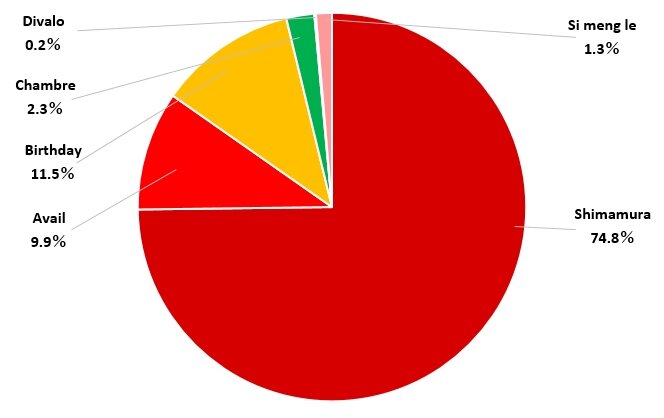
Business breakdown of sales
/
|
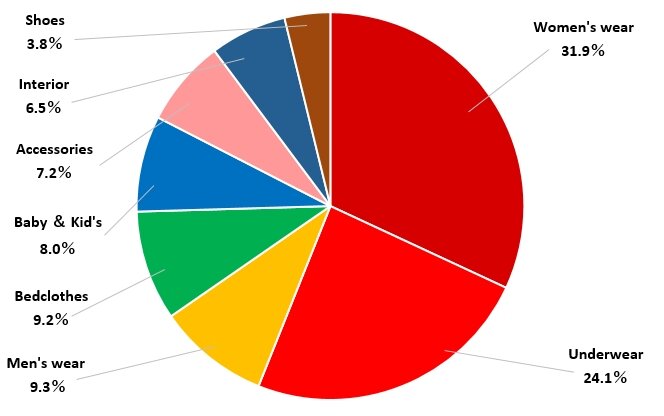
Product breakdown of sales |
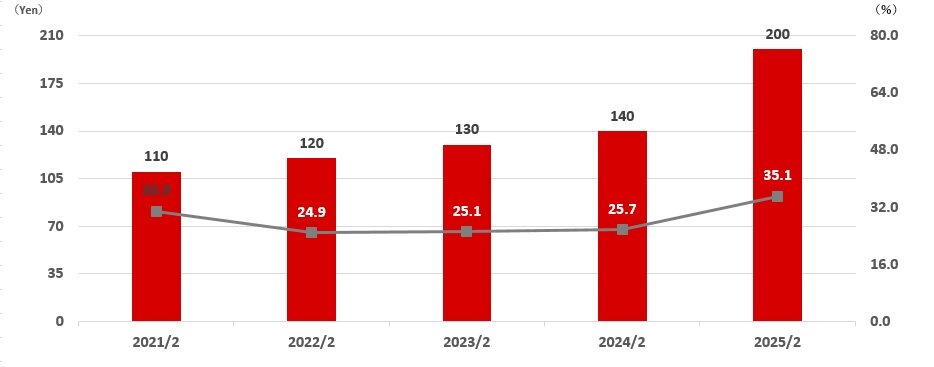
| Dividend / Dividend payout ratio |
Note: On February 21, 2024, Shimamura Co., Ltd. conducted a 2-for-1 common stock split.
Dividends for FY 2/2021 to FY 2/2024 have been calculated on the presumption of this stock split being carried out.
| index (unit) | FY2/2021 | FY2/2022 | FY2/2023 | FY2/2024 | FY2/2025 |
|---|---|---|---|---|---|
| Net sales (million yen) | 542,608 | 583,618 | 616,125 | 635,091 | 665,358 |
| YoY (%) | 104.0 | 107.6 | 105.6 | 103.1 | 104.8 |
| Ordinary income (million yen) | 39,404 | 50,567 | 54,383 | 56,716 | 60,596 |
| YoY (%) | 165.2 | 128.3 | 107.5 | 104.3 | 106.8 |
| Net income (million yen) | 26,163 | 35,428 | 38,021 | 40,084 | 41,885 |
| YoY (%) | 199.3 | 135.4 | 107.3 | 105.4 | 104.5 |
| Earning per share (Yen) | 711.93 | 964.04 | 517.28 | 545.35 | 569.83 |
| Total assets (million yen) | 451,798 | 474,811 | 502,552 | 533,807 | 567,144 |
| Net assets (million yen) | 384,388 | 410,995 | 440,048 | 471,408 | 500,976 |
| Retail floor space (m2) | 2,219,764 | 2,225,121 | 2,233,275 | 2,248,917 | 2,275,250 |
| Number of stores (Stores) | 2,199 | 2,204 | 2,213 | 2,227 | 2,251 |
| Number of employees (person) | 3,113 (11,913) |
3,086 (12,005) |
3,098 (11,942) |
3,157 (12,248) |
3,253 (12,551) |
On February 21,2024, Shimamura Co., Ltd. conducted a 2-for-1 common stock split. Earnings per share have been calculated on the presumption that the stock split was conducted at the beginning of the Fiscal year ending February 2023.
The number of employees is the number of full-time employees, and does not include regular part-time employees, part-time employees, and rehired retired employees. For regular part-time employees, the average number of full-time equivalent employees per year is shown in parentheses.

